Getting Started
For non-technical users, it is recommended to download the spreadsheet model present in the main DICE GitHub repository page entitled Oughton et al. (2022) DICE.xlsx.
The overall sequence of the DICE model is visualized in Figure 1.
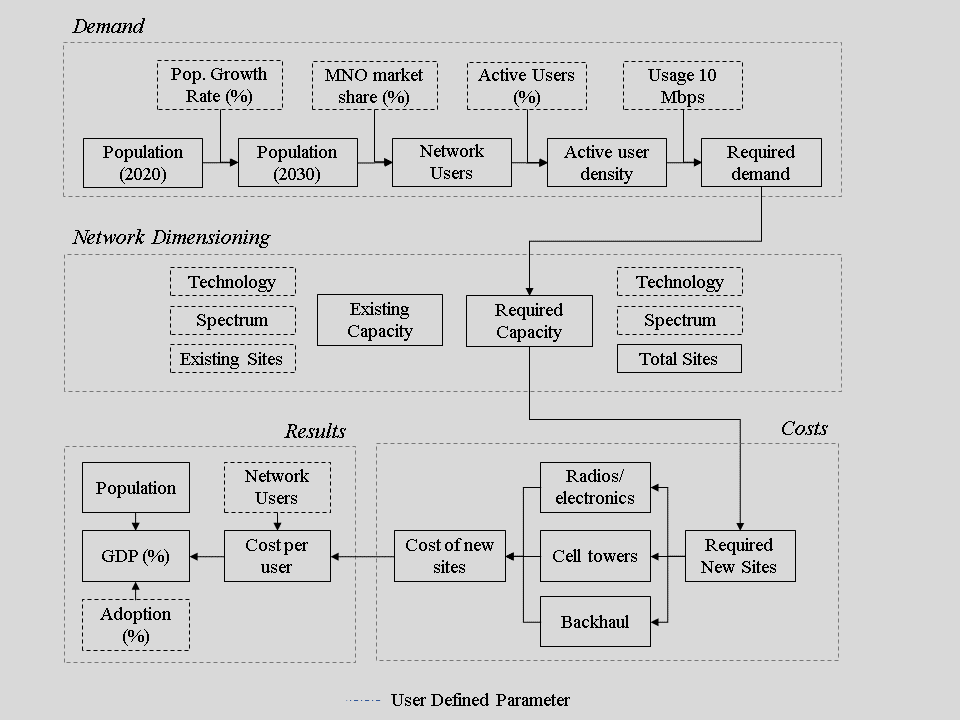
Figure 1. Box diagram demonstrating the DICE method.
Estimation of Data Demand Density
The data demand density is a necessary parameter for the model to determine the required traffic needing to be served. First, the number of active users is required.
## Step 1 - Obtaining active smartphone users
The aim here is to obtain the quantity of active smartphone users each population density decile for the busiest hour of the day.
The current population in the starting year is provided, having been extracted from the WorldPop global data layer. The aim is to find the population in the final year of the assessment period, for example, in 2030, so that Target 9c can be fully achieved.
The user can define the population growth rate (G). Dice will then estimate the population in the final year that we want to serve.
However, the user can still set the expected smartphone adoption rate for the end of the assessment period, as there is no guanrantee 100% of the population will be able to afford, be willing or capable of using a smartphone. Most universal broadband assessment target 95% population coverage, making this a sensible parameter to aim for.
A key principle of the approach is that a hypothetical cellular network needs to be modeled. This is so that the traffic engineering assessment can be carried out. This means the model uses a specific market share for the hypothetical network to serve a defined customer base. This method eventually yields a cost of serving a single user, which feeds into the universal broadband calculations produced at the end of the model. Thus, the model uses a market share (e.g., 30%) to reflect the share of the overall smartphone user base the network will serve.
Next, it is important to recognize that not all users access the network simultaneously. Often only one in twenty users are actively exchanging traffic, on average, at any one time within a site area (so approximately 5% of the customer base of a network). Consequently, the percentage of active users at any one time needs to be defined.
## Step 2 - Obtaining the traffic demand density
Now we have the quantity of active users, we can multiply this value by the required per user data rate (e.g., 10 Mbps), and then divide to get the traffic density (Mbps/km^2).
## Step 3 - Estimating the required per user data rate
This can be achieved in two ways:
The user can specify the capacity each user should receive (e.g., 10 Mbps)
The user can specify the monthly data consumption each user will consume (e.g., 2 GB)
As the first method is a capacity stated in second, this metric can be used in its current form. Whereas with the second approach, we need to convert the monthly data consumption to an average daily consumption. We then need to convert to an hourly estimate based on the percentage of the traffic taking place in the busiest hour of the day (e.g. 15%). This traffic quantity can then be converted to the number of Megabits per second (Mbps) required.
Estimation of Necessary Infrastructure Upgrades
Now the demand density figure has been obtained, it is necessary to estimate (i) the network capacity based on the existing number of cell sites, and (ii) the necessary number of new sites required to meet the demand density.
The approach taken is to deploy 4G infrastructure to provide wide-area mobile broadband. The capacity of a wireless cellular network is dependent on a combination of the density of cellular sites, the efficiency of the technology (e.g., 4G) and the bandwidth of the spectrum channels available to exchange information over (e.g., 10 MHz).